Spectrometry 10-07-2023
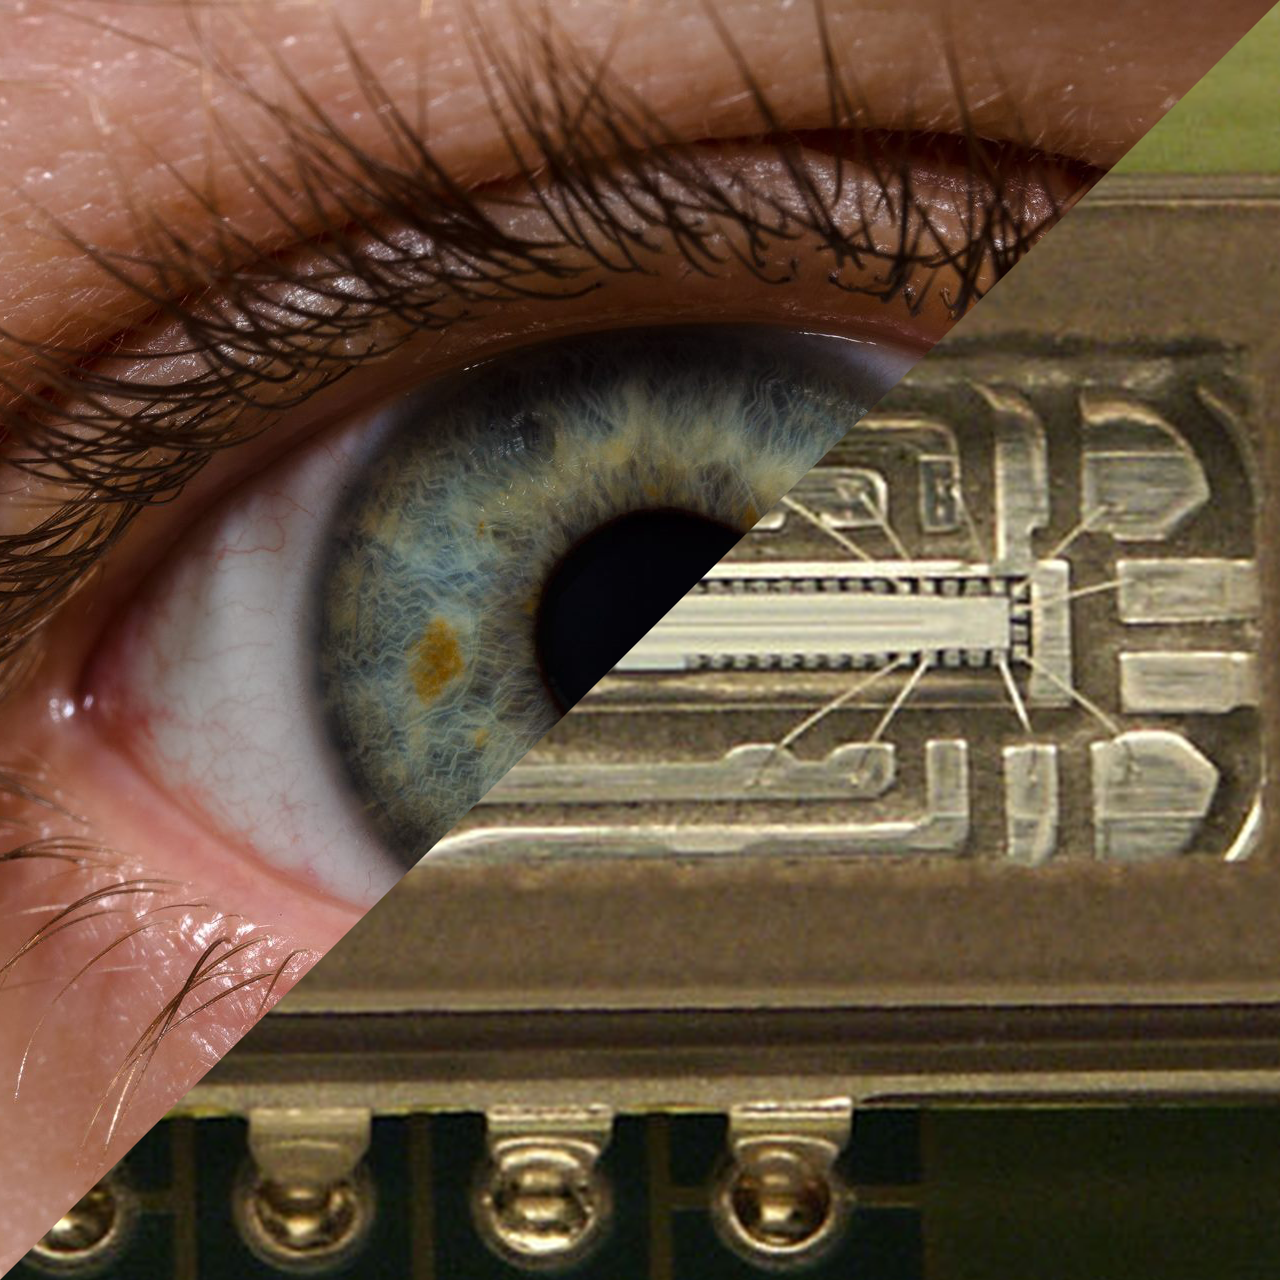
Top left is a photo of a human eye.
Source: (October 2, 2005) Wikipedia Commons:
Bottom right is a die shot of a linear CCD.
In many industries and application areas, spectroscopy methods are used to identify compounds by comparisons with reference spectra. For example, recording UV and NIR spectrograms have been standard methods in forensic investigations for many decades. The important element is the comparison. A library of reference spectra allows comparison to be made between a captured spectra and a reference, to identify the compound. It's a simple case of pattern matching.
A spectrum analyser is a vital piece of equipment in electronics design, especially in radio equipment. The ability to monitor power against frequency is vital. A spectrum analyser can be used for multiple applications such as voice and data communications (like cellular radio or radio communications); video broadcast distributed via satellite using DVB-S and DVB-S2 formats, and digital video broadcast using the DVB-T format; radar, like radar transmitter test analysis; and spectrum management and interference hunting. We have some experience with UWB (ultra wideband).
We are particularly interested in optical spectrometry, which is used to measure light intensity in the ultraviolet (UV), visible (VIS), near-infrared (NIR), and infrared (IR) range of the electromagnetic spectrum.
The eye
Sight is the primary sense used by most people to experience the world around us. It is therefore natural for the analysis and characterisation of light to be of keen interest to us as a species. The most basic tool we have for this job is the human eye. The eye is an incredibly versatile tool that is capable of analysing colour and brightness in a whole image.
However, it is not capable of direct measurement of wavelengths only inferring them. Whereas a basic spectrometer, although only able to analyse a single source of light may precisely measure the amounts of specific wavelengths in a light source. This makes them far more useful scientific instrument.
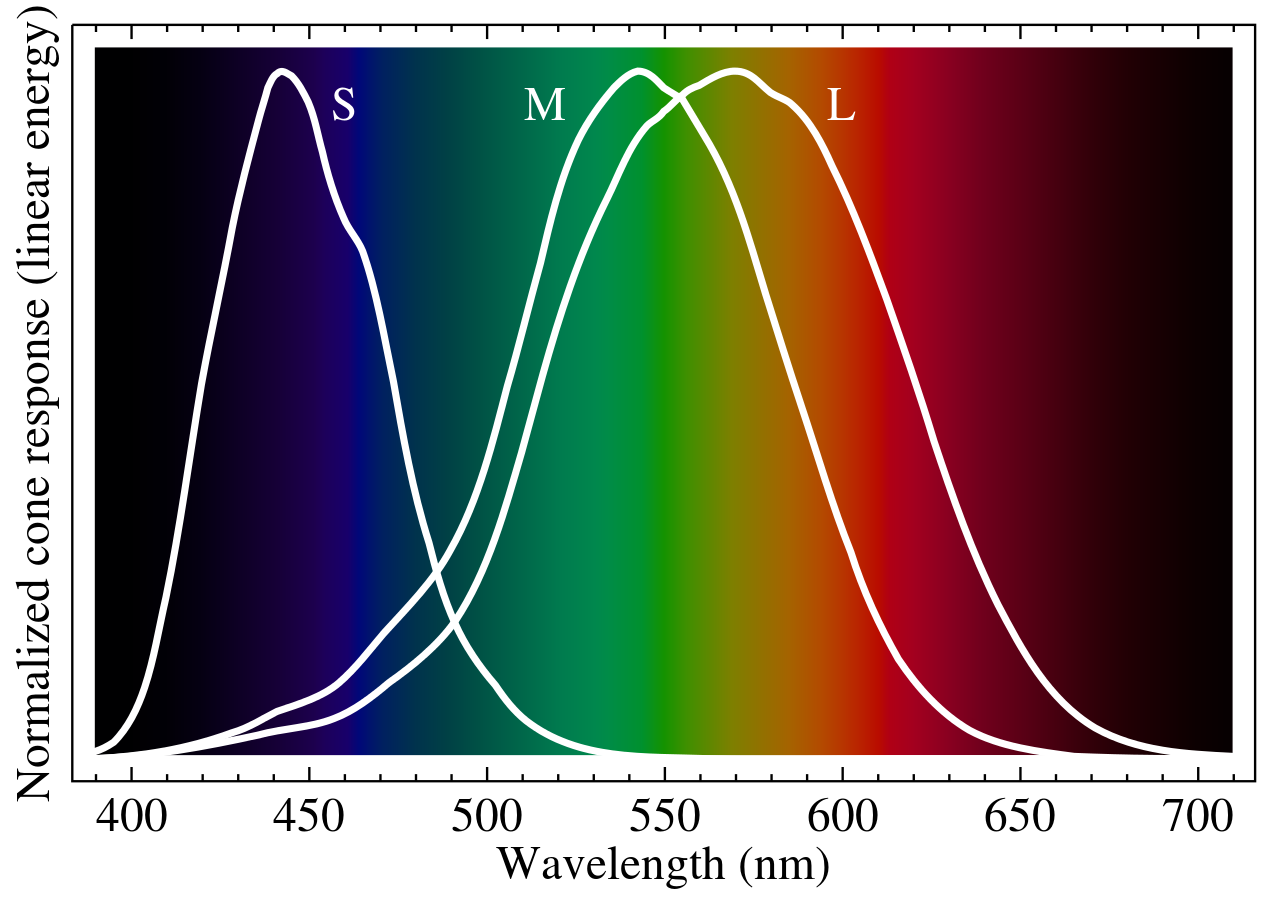
The human eye perceives colour using specialised cells in our eyes, known as cone cells. These cells come in three variations (known as S, M and L types) that are specialised to detect light in different wavelength bands.
When one of these cells is triggered by enough light it sends a signal to the brain however this signal does not contain any information about the wavelength of light of the photons only that the type of cell it triggered was sensitive to a particular band of light.
But in this case, how does the brain not just see 3 colours one for each type of cell?
The brain can use data from all of the light-sensitive cells in the eye. With data from many millions of cells sensitive to light the brain can analyse the number of each of the 3 types of colour-sensitive cells that have been triggered and present colour to us that would be created by the proportions of light incident on our eyes.
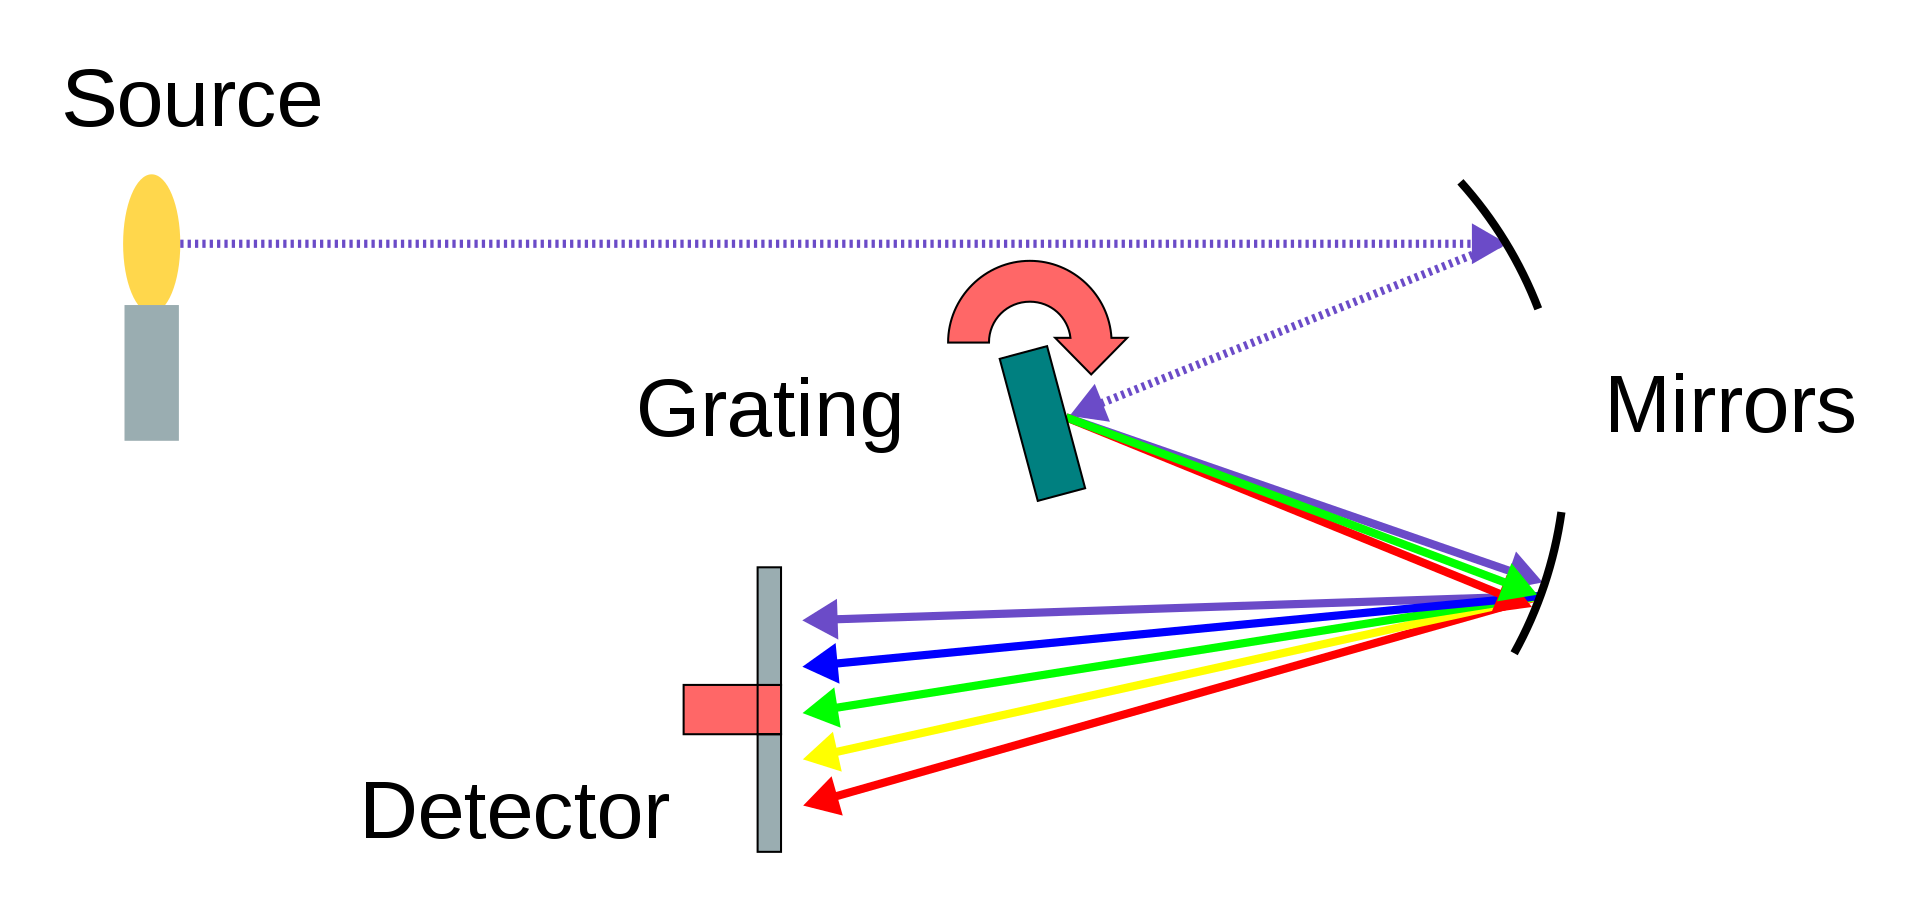
Spectrometers have a different approach to measuring light. Instead of having a specialised sensor to measure each wavelength in a light source., spectrometers generally split the light that enters for measurement using a diffraction grating. This produces a spectrum of light with the intensity along the spectrum corresponding to the amount of light of that spectrum. This varying intensity is then measured by a 1 by n CCD, a process we discussed earlier in this short article.
An interesting way to visualise this is with an RGB LED. If we take a look at some white light from the RGB LED, we can see in the spectrometer output three distinct peaks of light at 475nm (nanometre), 525nm and 630nm with these wavelengths corresponding to blue, green and red respectively.
To illustrate this, we set up an RGB LED to cycle through a rainbow of colours and pointed our spectrometer at it to observe the real-time changing intensity of the three wavelengths. This highlights that although we see a full rainbow of colours the emitted light is only composed of the red, green, and blue produced by the LED components.
Optical spectrometry
Optical spectrometry covers the following measurements.
Absorbance
From UV to NIR wavelengths, absorbance measurements provide information about the chemical composition of materials in all states of matter.
Colour
In simplest terms, colour is one of the ways humans perceive light. Colour reflected from, or emitted by samples can be measured using basic colour meters or more robust spectral devices for detailed analysis of different colour properties.
Fluorescence
Fluorescence is the absorption and emission of light of two different frequencies. Typically, a lower wavelength of incident light is absorbed from one direction, and a higher wavelength of light is emitted in all directions.
Irradiance
Irradiance is the amount of energy emitted at each wavelength from a radiant sample such as an LED, a laser or the sun. From that data, more specific intensity values can be calculated.
Raman
Raman spectroscopy uses scattering of laser light to probe molecular structure. Of every million photons scattered, a single photon will interact with the vibrational states of a sample molecule and emit light of a different wavelength.
Reflectance
Reflectance is light incident on the surface of a material that is reflected at an interface. Light not reflected from the sample is absorbed, scattered or transmitted.
Transmittance
Transmittance is light incident on a sample that transmits through it. If the sample has low scatter (as with a clean, dilute solution), almost all the light not absorbed will be transmitted.